The 5 Most Useful Power BI Features
We recently completed a data centralization project where we needed to retrieve information from multiple sources into an internal database and have a cohesive representation of our data for multi-level review. After forming the relationships between our sources, we leveraged Power BI to showcase the new intel. Power BI is an interactive data visualization and reporting tool that offers self-service Business Intelligence capabilities. It allows you to connect with countless, popular data sources and effortlessly display information from them in a meaningful manner. I found that not only can Power BI work wonders with data, but it can also proactively schedule notifications or alerts for specified values. As our team has explored the many benefits of this service, I am even more confident that Power BI will broaden your capacity to make more informed and intelligent decisions in the workplace. Here are my top 5 most useful features in Power BI:
Dynamically Receive Data-Driven Alerts
Let’s say you would like to be notified when a specific data value falls under a threshold. For example, you want to know when a high-demand product falls below a certain threshold in your inventory so you can maintain a healthy stock while it is in high demand for a season. Or you want to keep track of sales by the department in order to prevent sluggish performance and resolve issues before the end of each quarter. You can easily set up an alert for when specified data reaches a goal or falls under a fixed amount.
You can also trigger a Microsoft Flow to kick-off once a pre-set condition is met (learn more about how Microsoft Flows works). While Power BI can do a lot more than this in managing your data, this is a simple but versatile tool that goes a long way.


Conveniently Distribute Report or Dashboard
I wanted to create a new dashboard showcasing key performance indicators (KPIs) with insights on certain trends in a department; visualizations depicting geographical sales performance and even some drill-downs into layered accounting data. Next, I wanted to share it with someone. Power BI allows the dissemination of dashboards and reports onto other *users. By simply clicking on the link generated in an email invitation, I can give access to a dashboard or report in the web browser. No need for even downloading an application to view the content!
*Note: You need a Power BI Pro license to share your content but not see the content.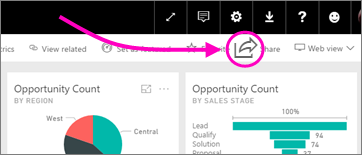
Build Custom Dashboards Sourced from Other Dashboards
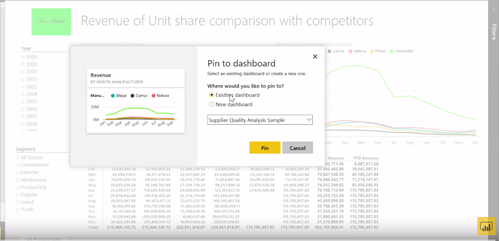
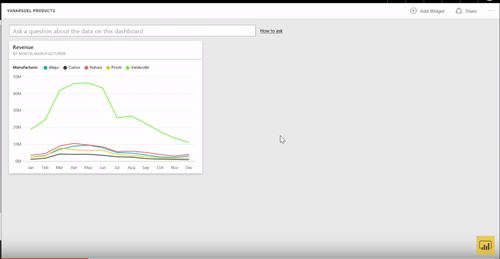
When collaborating with different teams, one team may share their dashboard with you to showcase their data in charts and tables while another team shares a different dashboard with their own information. Upon review, you find that only one or two of the charts are relevant to your department. Power BI will allow you to grab specific parts or objects on multiple dashboards (a chart or table for example) and pin that to your personal dashboard. So in other words, you can pick and choose from other dashboards to build your own custom dashboard with the insights, KPIs, or drill-downs that only you want to see.
Embed Dashboards & Reports Onto Other Platforms
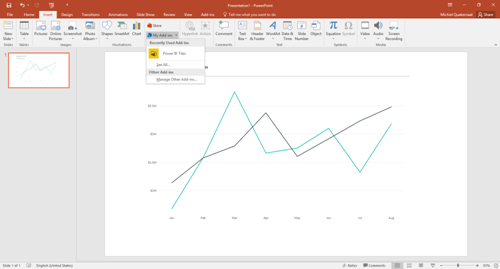
There is nothing like showing off your hard-earned work without having to work hard at showing it off. Let’s say you would like to showcase Power BI reports or dashboards in a PowerPoint presentation or keep an up-to-date chart on a page in a SharePoint site. There is a Microsoft Partner company called DevScope that has add-on tools allowing you the ability to enable this functionality. The best part is, you can set up the embedded reports or dashboards to automatically refresh current data so your presentations and SharePoint sites are always up-to-date with the latest and greatest information.

Powerfully Utilize ‘Power Query’ to Pull in Common Data Sources
At some point, it is important to gauge the versatility of certain social media platforms to determine their usefulness in engaging potential leads or driving traffic to your website. So if you wanted to grab data from Facebook to track how much engagement, likes, or comments that specific posts are receiving; it can be added to your Power BI as a data source. You can also grab financial data from an accounting application like QuickBooks to build some insight to oversee and monitor your financial health. ‘Power Query,’ provides a way to pull information from countless data sources where you can automatically connect and update data. This will save time in preventing the task of exporting and uploading data files from each separate source every time you need to analyze them. Once you have your data sources defined and pulling information, you can then append different ones together and make better sense of all of it in one place.
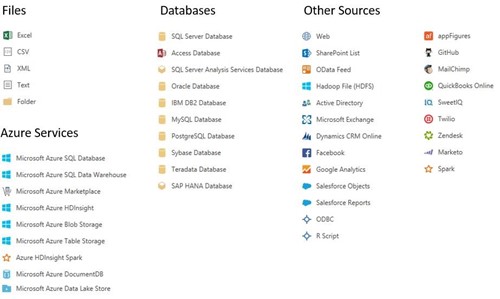
For a more detailed list of data sources, you can automatically pull in via Power BI, click here
![]()